Curvature Map
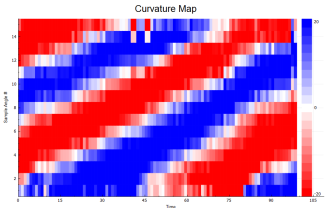
With this analysis, yo can visualize the curvature of the worm's centerline.
The curvature amplitude is color-coded and plotted along the worm's centerline with the horizontal axis "time" (number of frames) and the vertical axis "position" (represented as sample angle numbers).
The color scale is displayed on the right. In the example above, the most vibrant red (bottom of the scale)represents a minus 20 degree-angle and the most vibrant blue (top of the scale) represents a 20 degree-angle.
WormLabcan display up to 1024 frames.
- To see data for a different track, enter a different Track ID in the Curvature Map options.
WormLabprovides measurements for the sample angles along the worm's centerline.
- To adjust the number of sample angles, enter a different Sample Angles value in the Curvature Map options.
The greater the number of sample angles, the smaller the angle values since the bend of the worm is spread across a greater number of segments.
Reference
This analysis is based on the curvature map analysis described in Genetic analysis of crawling and swimming locomotory patterns in C. elegans (Pierce-Shimomura, Chen, Mun, et al., 2008).